Analytics Dashboard
Purpose and Scope
This page documents the Analytics Dashboard feature, which provides web analytics visualization using Cloudflare's Web Analytics GraphQL API. The dashboard displays visitor statistics, page views, browser/OS distributions, and time-series data with interactive date range selection.
This page covers the Cloudflare component and its associated DateRangeSelector component. For information about other feature modules, see Feature Modules. For UI component documentation, see UI Components.
Overview
The Analytics Dashboard is a standalone feature accessible via the /stats route. It operates independently of the authentication system and does not require the w (WebPortal) prop like other feature modules. Instead, it connects directly to Cloudflare's GraphQL API to fetch and visualize web analytics data.
The dashboard provides:
- Aggregate statistics: Total visitors and page views for a selected time range
- Time-series visualizations: Visits and page views over time displayed as area charts
- Distribution analytics: Browser and OS usage shown as pie and bar charts
- Flexible date range selection: Preset ranges (15 minutes to 7 days) and custom date/time selection
Sources: jportal/src/components/Cloudflare.jsx1-497
Component Architecture
Main Component Structure
Diagram: Cloudflare Component Architecture
The Cloudflare component (jportal/src/components/Cloudflare.jsx16-497) orchestrates the entire analytics dashboard. It manages date range state, invokes custom hooks for data fetching, and renders multiple visualization types using Recharts components wrapped in shadcn/ui chart containers.
Sources: jportal/src/components/Cloudflare.jsx1-497
State Management
Date Range State
The component maintains date range state initialized to the last 7 days:
| State Variable | Type | Purpose |
|---|---|---|
dateRange |
{from: Date, to: Date} |
Current selected date range for analytics queries |
themeState |
Zustand store | Theme configuration for dynamic chart colors |
forceUpdate |
{} |
Triggers re-render when theme changes |
Sources: jportal/src/components/Cloudflare.jsx17-38
Theme Integration
The component subscribes to the theme store to dynamically retrieve chart colors:
getChartColor(index) => getComputedStyle(document.documentElement)
  .getPropertyValue(`--chart-${(index % 5) + 1}`)
This function retrieves CSS custom properties (--chart-1 through --chart-5) defined by the current theme preset, ensuring visualizations match the selected theme.
Sources: jportal/src/components/Cloudflare.jsx17-31
Data Fetching Layer
Custom Hooks Architecture
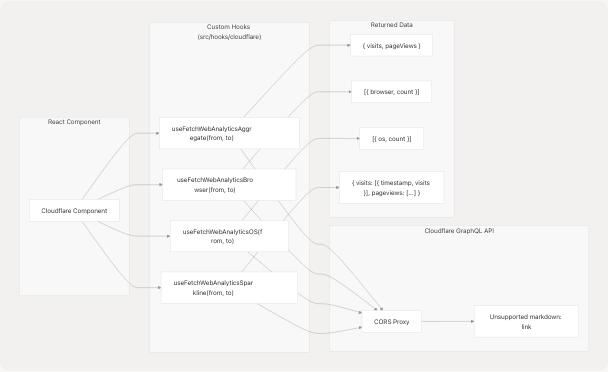
Diagram: Data Fetching Flow
Each custom hook makes GraphQL queries to Cloudflare's Web Analytics API through a CORS proxy. The hooks accept from and to Date parameters and return data objects along with loading states.
Sources: jportal/src/components/Cloudflare.jsx4-9 jportal/src/components/Cloudflare.jsx91-100
Hook Invocations
The component invokes four hooks with the current date range:
// Aggregate stats
const { data: aggregateData, isLoading: aggregateLoading } =
  useFetchWebAnalyticsAggregate(dateRange.from, dateRange.to)

// Browser distribution
const { data: browserData, isLoading: browserLoading } =
  useFetchWebAnalyticsBrowser(dateRange.from, dateRange.to)

// OS distribution
const { data: osData, isLoading: osLoading } =
  useFetchWebAnalyticsOS(dateRange.from, dateRange.to)

// Time-series data
const { data: sparklineData, isLoading: sparklineLoading } =
  useFetchWebAnalyticsSparkline(dateRange.from, dateRange.to)
Sources: jportal/src/components/Cloudflare.jsx91-100
Date Range Selection
DateRangeSelector Component
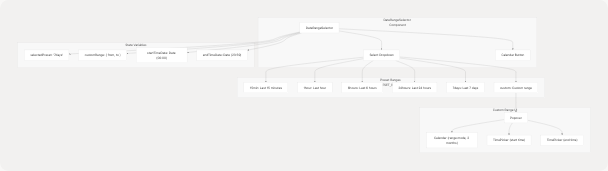
Diagram: DateRangeSelector Component Structure
The DateRangeSelector component provides two interaction modes:
- Preset selection: Quick access to common time ranges via dropdown
- Custom selection: Date range picker with calendar and time inputs
Sources: jportal/src/components/DateRangeSelector.jsx1-177
Preset Ranges Configuration
The component defines preset ranges in the PRESET_RANGES object:
| Preset Key | Label | Duration (minutes) |
|---|---|---|
15min |
Last 15 minutes | 15 |
1hour |
Last hour | 60 |
6hours |
Last 6 hours | 360 |
24hours |
Last 24 hours | 1440 |
7days |
Last 7 days | 10080 |
custom |
Custom range | null |
Sources: jportal/src/components/DateRangeSelector.jsx10-17
Preset Range Selection
When a user selects a preset:
handlePresetChange(value) {
  if (value === "custom") {
    // Open calendar popover
    setTimeout(() => setIsCalendarOpen(true), 100)
    return
  }

  // Calculate date range from preset
  const preset = PRESET_RANGES[value]
  const to = new Date()
  const from = new Date(to.getTime() - preset.minutes * 60 * 1000)
  onDateRangeChange({ from, to })
}
Sources: jportal/src/components/DateRangeSelector.jsx37-57
Custom Range Selection
When custom is selected, a Popover opens with:
- Calendar component: Range mode with 2 months displayed (jportal/src/components/DateRangeSelector.jsx136-152)
- Time pickers: Start and end time inputs (jportal/src/components/DateRangeSelector.jsx153-157)
The calendar restricts selection to dates between 2020-01-01 and the current date.
Sources: jportal/src/components/DateRangeSelector.jsx59-103 jportal/src/components/DateRangeSelector.jsx136-159
Time Picker Components
The TimePicker component (jportal/src/components/ui/time-picker.tsx14-40) uses two TimePickerInput instances for hours and minutes. It manages:
- Hour input: 24-hour format (00-23)
- Minute input: Standard format (00-59)
- Arrow navigation: Left/right arrow keys move between inputs
- Up/down arrows: Increment/decrement time values
Sources: jportal/src/components/ui/time-picker.tsx1-40 jportal/src/components/ui/time-picker-input.tsx1-122
Visualizations
Aggregate Statistics Cards
The dashboard displays two metric cards at the top:
┌─────────────────────────┐  ┌─────────────────────────┐
│ Total Visitors          │  │ Total Page Views        │
│                         │  │                         │
│ 1,234                   │  │ 5,678                   │
└─────────────────────────┘  └─────────────────────────┘
These cards use the aggregateData from useFetchWebAnalyticsAggregate:
aggregateData.visits→ Total VisitorsaggregateData.pageViews→ Total Page Views
While loading, Skeleton components display placeholder UI.
Sources: jportal/src/components/Cloudflare.jsx119-145
Time-Series Charts
Visits Over Time (Area Chart)
The component renders an AreaChart with:
- Data source:
sparklineData.visitsarray of{ timestamp, visits }objects - X-axis: Timestamps formatted as
"MMM DD" - Y-axis: Visit counts
- Styling: Gradient fill with dynamic theme color
- Tooltip: Custom tooltip showing formatted date/time and visit count
Sources: jportal/src/components/Cloudflare.jsx147-231
Page Views Over Time (Area Chart)
Similar structure to the visits chart but uses sparklineData.pageviews:
- Data source:
sparklineData.pageviewsarray - Color: Uses
getChartColor(1)(second theme color)
Sources: jportal/src/components/Cloudflare.jsx233-317
Distribution Charts
Both browser and OS distributions use a dual-chart approach:
Chart Configuration
Each distribution section displays:
- Pie Chart: Donut style with
innerRadius={60} - Bar Chart: Horizontal layout showing exact counts
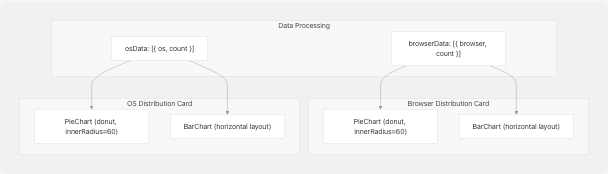
Diagram: Distribution Chart Architecture
Sources: jportal/src/components/Cloudflare.jsx319-493
Browser Distribution Implementation
The browser distribution card (jportal/src/components/Cloudflare.jsx321-407):
- Maps
browserDataarray to pie chart format with dynamic colors - Displays horizontal bar chart with browser names as Y-axis labels
- Uses
ChartContainerconfig for consistent theming
OS Distribution Implementation
The OS distribution card (jportal/src/components/Cloudflare.jsx409-492) follows identical structure to browser distribution but uses osData.
Dynamic Date Range Description
The component includes a helper function getDateRangeDescription() (jportal/src/components/Cloudflare.jsx44-89) that generates human-readable descriptions for chart subtitles:
| Condition | Description Output |
|---|---|
| Last 15-30 minutes | "last 15 minutes" / "last 30 minutes" |
| Last 1 hour | "last hour" |
| Last 3-6-12-24 hours | "last 3 hours" / "last 6 hours" / etc. |
| Last 1-7 days | "last 7 days" |
| Custom range | "5 days (Jan 1 to Jan 5)" |
This description appears in the CardDescription for time-series charts.
Sources: jportal/src/components/Cloudflare.jsx44-89 jportal/src/components/Cloudflare.jsx151 jportal/src/components/Cloudflare.jsx237
Configuration
Environment Variables
The analytics dashboard requires the following environment variables (defined in jportal/.env.example1-7):
| Variable | Purpose | Example Value |
|---|---|---|
VITE_CLOUDFLARE_API_TOKEN |
Authentication token for Cloudflare API | g29zrxuDBV3FfsTpC3q4_... |
VITE_CLOUDFLARE_PROXY_URL |
CORS proxy endpoint | https://cors-header-proxy.my-malikyash.workers.dev |
VITE_CLOUDFLARE_BASE_URL |
Cloudflare GraphQL endpoint | https://api.cloudflare.com/client/v4/graphql |
VITE_CLOUDFLARE_ACCOUNT_TAG |
Cloudflare account identifier | 2af5100754a8644e0e2a576365803123 |
VITE_CLOUDFLARE_SITE_TAG |
Site/zone identifier | b34248b80c7a4ca6ba091bdefee60093 |
These variables are accessed by the custom hooks (not shown in provided files) to construct GraphQL queries.
Sources: jportal/.env.example1-7
Integration with Application
Routing and Navigation
The analytics dashboard is accessible via the /stats route. Unlike other feature modules that are rendered within AuthenticatedApp, the Cloudflare component:
- Uses
PublicHeaderwith back button (jportal/src/components/Cloudflare.jsx106) - Does not require authentication
- Operates independently of the
w(WebPortal) prop
Layout Structure
┌──────────────────────────────────────┐
│ PublicHeader (sticky, showBackButton)│
├──────────────────────────────────────┤
│ Stats for Nerds 🤓                   │
│ Web Analytics Dashboard              │
│                        [Date Selector]│
├──────────────────────────────────────┤
│ [Total Visitors] [Total Page Views]  │
├──────────────────────────────────────┤
│ Visits Over Time (Area Chart)        │
├──────────────────────────────────────┤
│ Page Views Over Time (Area Chart)    │
├──────────────────────────────────────┤
│ [Browser Dist.] [OS Distribution]    │
└──────────────────────────────────────┘
The layout uses responsive grid classes:
- Aggregate cards:
grid gap-4 md:grid-cols-2 - Distribution charts:
grid gap-6 xl:grid-cols-2
Sources: jportal/src/components/Cloudflare.jsx102-494
Loading and Error States
The component handles loading states for each data source independently:
| Data Type | Loading Check | Skeleton Display |
|---|---|---|
| Aggregate stats | aggregateLoading |
<Skeleton className="h-8 w-24" /> |
| Time-series | sparklineLoading |
<Skeleton className="h-[300px] w-full" /> |
| Browser data | browserLoading |
<Skeleton className="h-[400px] w-full" /> |
| OS data | osLoading |
<Skeleton className="h-[400px] w-full" /> |
When data is unavailable (empty arrays), the component displays fallback messages:
- "No visits data available"
- "No pageviews data available"
- "No browser data available"
- "No OS data available"
Sources: jportal/src/components/Cloudflare.jsx126-140 jportal/src/components/Cloudflare.jsx154-229 jportal/src/components/Cloudflare.jsx328-405 jportal/src/components/Cloudflare.jsx416-490